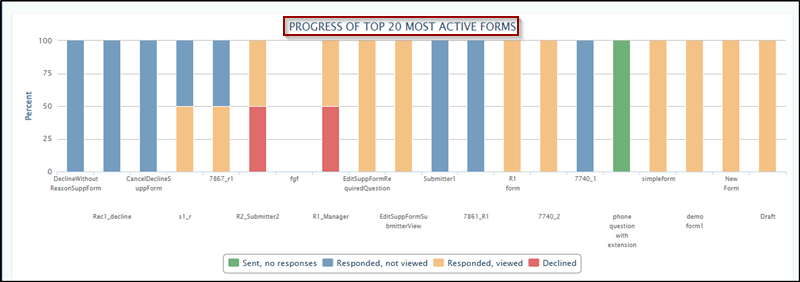
Progress of Top 20 Most Active Forms
The graph displays the 20 most active forms in a project. Different colors used in a graph represent the type of response for each form. Hover the mouse over a bar to view the count of each response type and to open the form.
TransPerfect’s Trial Interactive is an industry leader in practical, global eClinical innovation
PRODUCTS
 Linkedin
 X
X
Didn’t find what you need?
Our dedicated Project Management and Client Services team will be available to meet your needs
24 hours a day, 7 days a week.
Toll Free:
(888) 391-5111
help@trialinteractive.com
© 2025 Trial Interactive. All Rights Reserved
