Dashboard
The Overview Dashboard, which consists of a number of different dashlets, can be made available to users by room Administrators, depending on the needs of the client and the particular study room.
The dashlets are described here in the subsequent topics. The users can view and access the following options from the top menu bar.
The left side of the top menu bar displays the following options:
- Waffle icon: displays the modules available in the selected room
- Trial Interactive logo
- Room Name: displays the selected room name
- Module name: Selected module name in the room
-
Path name: Selected path name in the room

The right side of the top menu bar displays the following options:

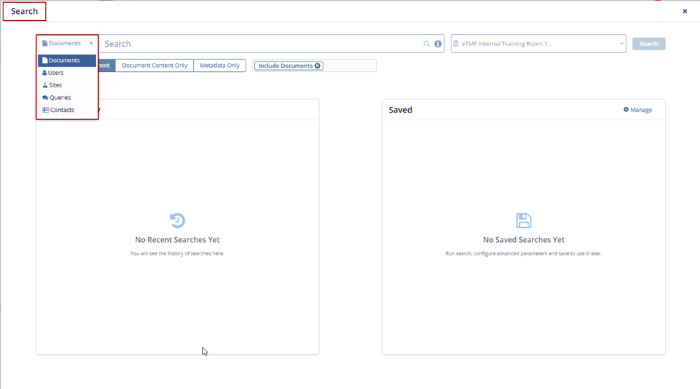
- Search icon:
- Click the search icon the Search pop-up window is displayed.
-
Expand the Documents arrow to search by Documents, Users, Sites, Queries, and Contacts.
 Note: Some hints to get better search results:
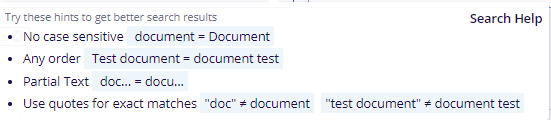
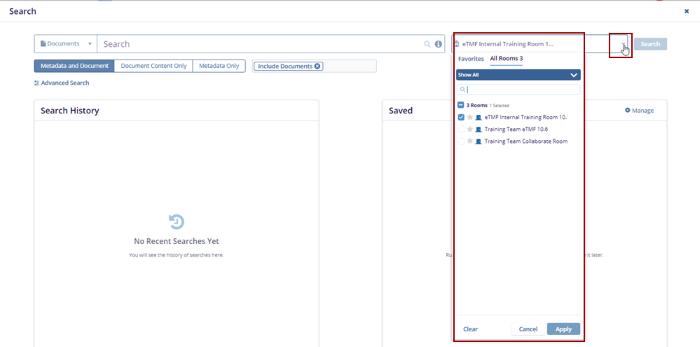
- The user can also search the Room by expanding the drop-down arrow shown in the
screenshot below:
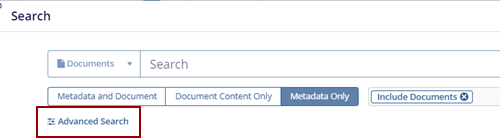
- Clicking the Advanced Search button in the
Search pop-up redirects the user to the Advanced Search page.
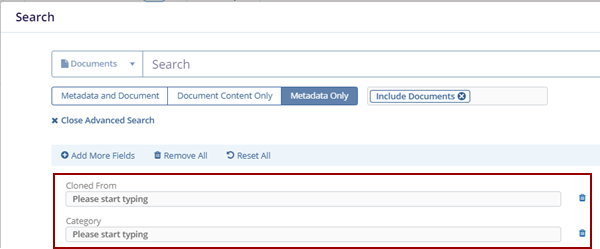
- Users can add unlimited fields as needed with the + Add More Fields button. The
Advanced Search – Add Fields pop-up window is displayed.
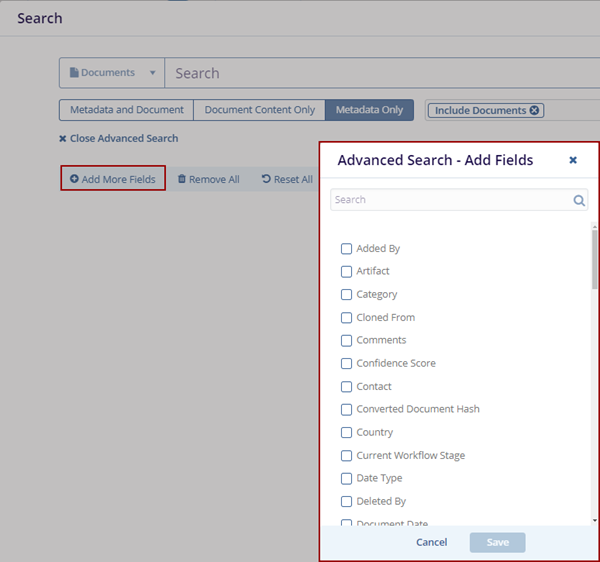
- Select the fields and click the Save button.
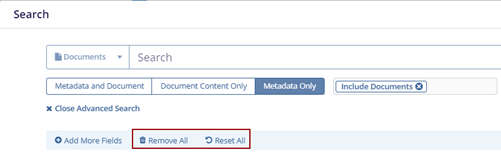
- Click the Remove All option to remove the added fields.
- Click Reset All, and it resets the page with
the existing information.
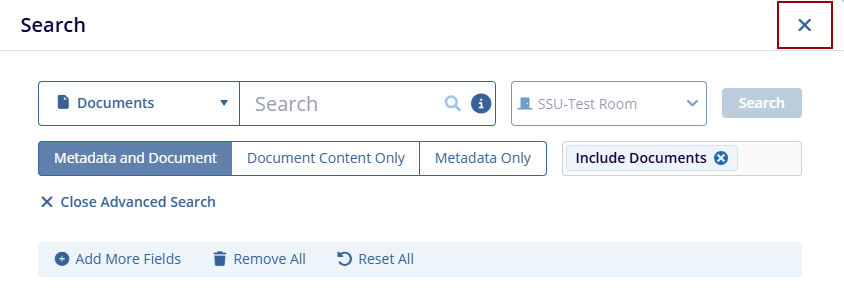
- Click the X icon to close the Search pop-up window.
- Add icon: Users can add the following by accessing this option:
- Documents:
- Click the Documents option, and the Import Documents screen is displayed.

- Click Browse File or Browse Folders to import documents, or simply drag and drop the
required file.
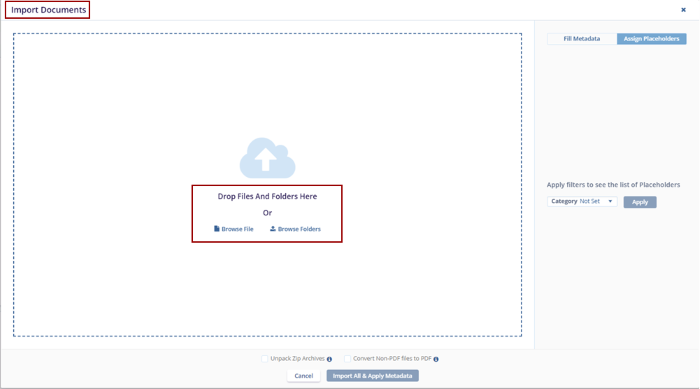
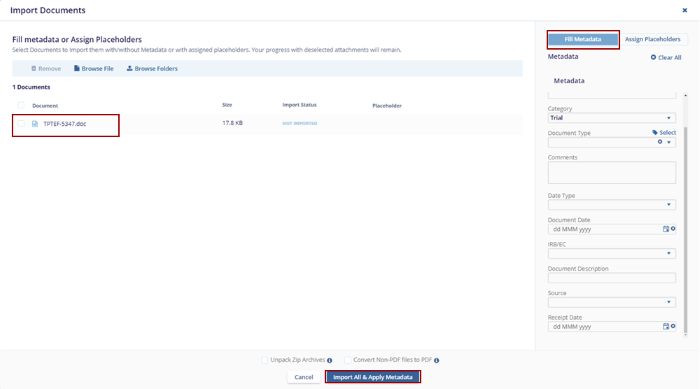
- Fill in the Metadata and click Import All & Apply
Metadata.
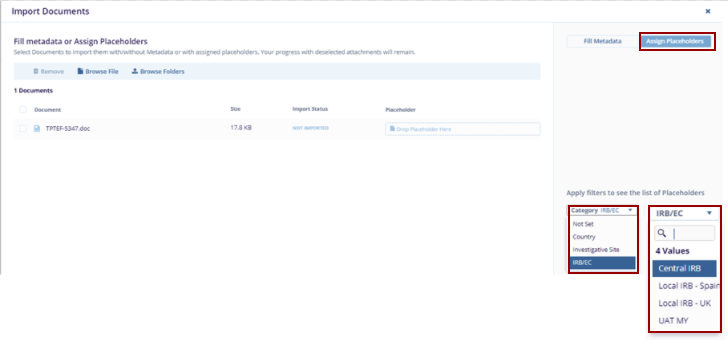
- The user can also assign the placeholders by clicking on the Assign Placeholders option.
- Apply the filters and click Import All & Apply Metadata.
- User: To learn more about User Invitation, follow the steps in Inviting Contacts and Managing Security.
- Task:
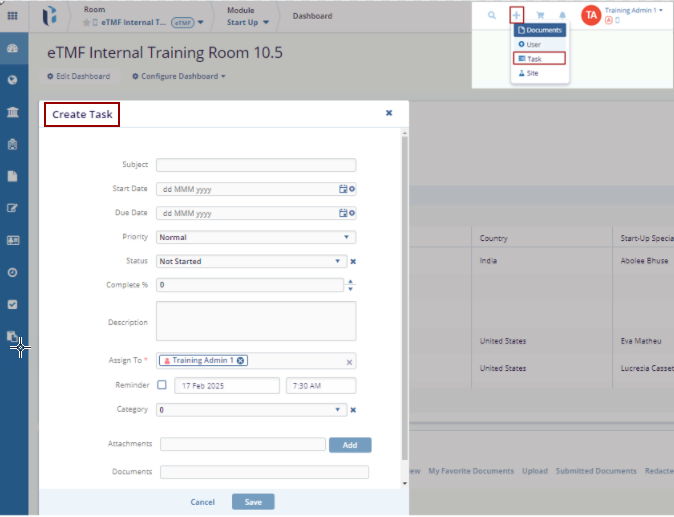
- Click the Task option, and the Create Task screen is displayed.
- Fill in all the required fields and click the
Save button.
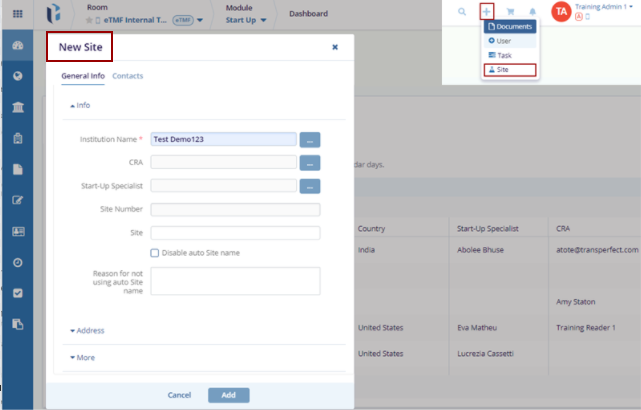
- Site:
- Click the Site option, and the New Site screen is displayed.
- Fill in all the required fields and click the
Add button.
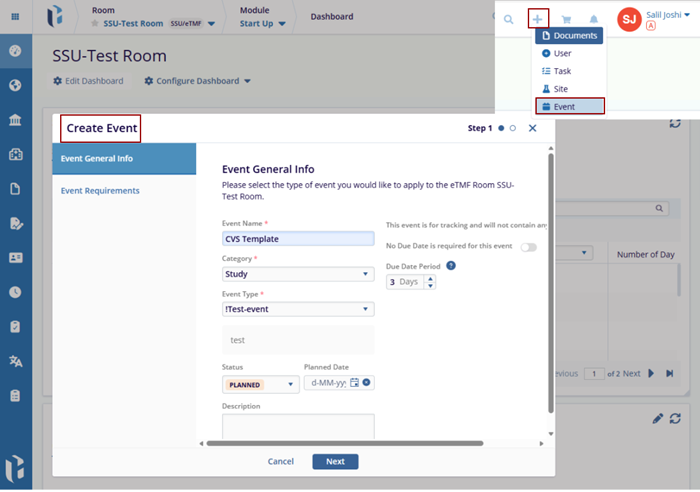
- Event:
-
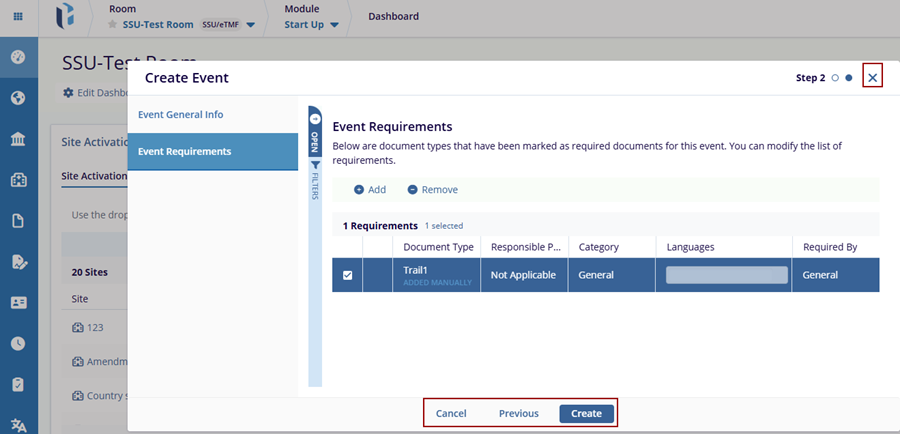
Click the Event option, and the Create Event screen is displayed.
-
Fill in all the required fields and click the Next button.
-
The Event Requirements section page is displayed.
Click the Add button, and the Add Document Type to Event pop-up window is displayed.
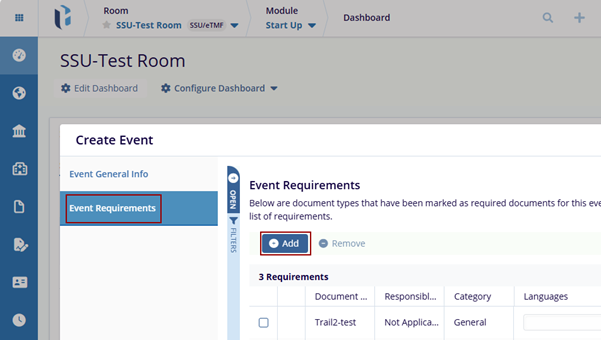
Add the type and click the Add button. The selected requirement will be displayed on the Create event pop-up window.
Select the requirement and click the Remove button to remove the requirement from the window.
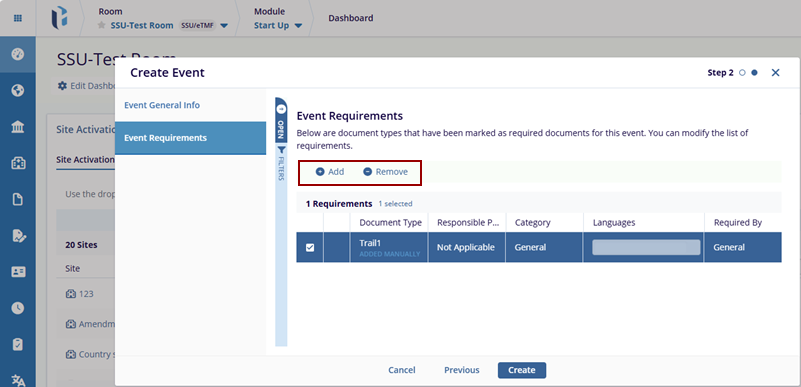
Click the Create button to create the event, the Cancel button to cancel the changes, and the Previous button to go to the previous page.
Click the X icon to close the Create Event pop-up window.
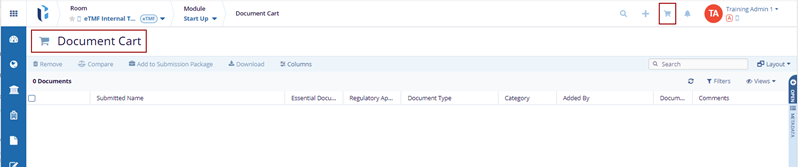
- Documents Cart icon: All documents added to the cart can be
viewed here.
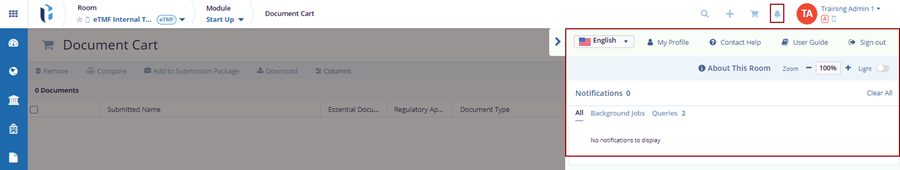
- Bell icon and Username: Displays the notifications, and users can access the following:
- Language Settings
- My Profile
- Contact Help
- User Guide
- Sign Out
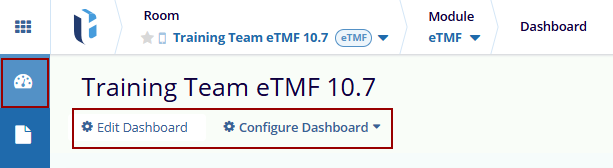
The Dashboard allows users to customize their workspace by adding, removing, or rearranging tabs based on user preferences. Administrator-level users can configure default dashboards for users according to the user access levels. Unless restricted, users can modify their dashboards to suit the user's needs.
The dashboard includes the following edit options:
The admin users and above have access to this option.
- Edit Dashboard
- Configure Dashboard
© 2025 Trial Interactive. All Rights Reserved
