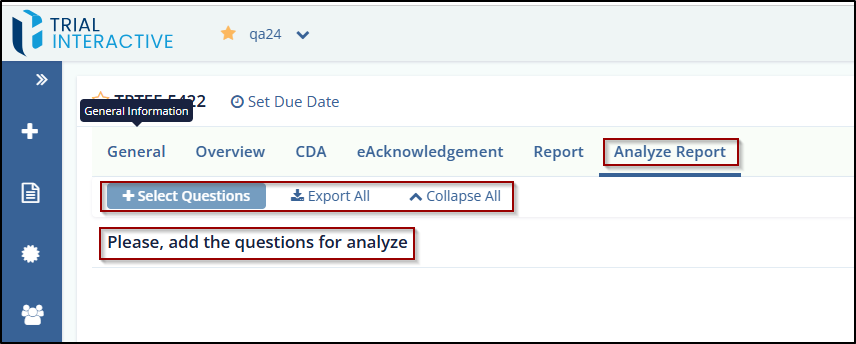
Analyze Report
This feature allows users to customize the view of the responses received for a form by selecting different chart types, including Bar, Column, Donut, and Pie.
To access this feature:
Navigate to the Forms tab in the left panel and click on the Analyze Report tab.
Note: The Select default view for all questions checkbox enables users to choose a default chart type for displaying the graphical representation of responses across all questions.
To analyze the Report, follow these steps:
Select the Select Questions option to begin configuring the report.
Check the Select All Questions box to include all questions, and then choose any specific questions you want to include.
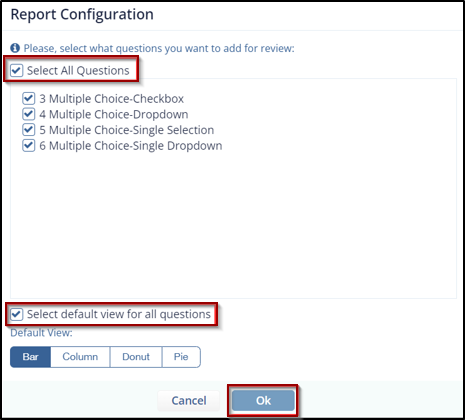
Click OK to save your selection and close the window.
The report will now be configured based on your selected questions.
You can download the report or change the sequence order of the questions:
• Select Option 1 in the image to download the report.
• Select Option 2 to change the order of the questions.
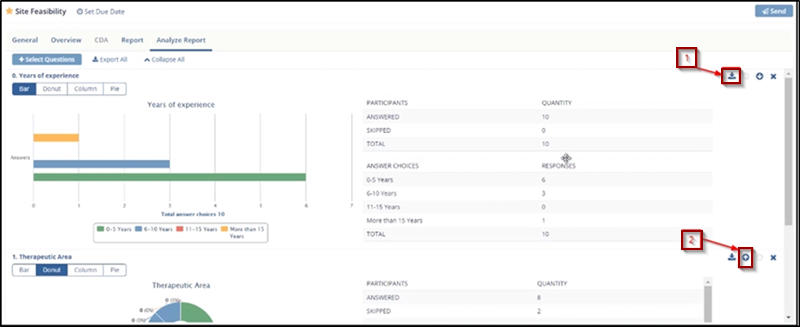
Click Save at the bottom to finalize and save the report.
TransPerfect’s Trial Interactive is an industry leader in practical, global eClinical innovation
PRODUCTS
 Linkedin
 X
X
Didn’t find what you need?
Our dedicated Project Management and Client Services team will be available to meet your needs
24 hours a day, 7 days a week.
Toll Free:
(888) 391-5111
help@trialinteractive.com
© 2025 Trial Interactive. All Rights Reserved
