Reports (Heatmap Settings)
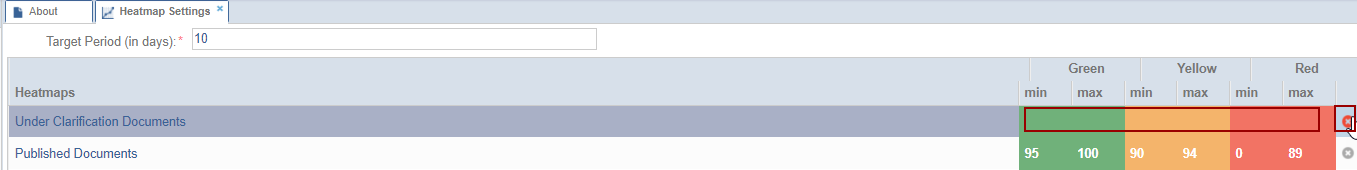
Trial Interactive allows the display of cross-room metrics in the KPI Dashboard, which can be accessed from the Home screen. The KPI heatmap is color-coded, (Green, Yellow, and Red) highlighting metrics that fall outside the acceptable range. The values for these metrics can be adjusted here. Double-click any setting to edit its value.
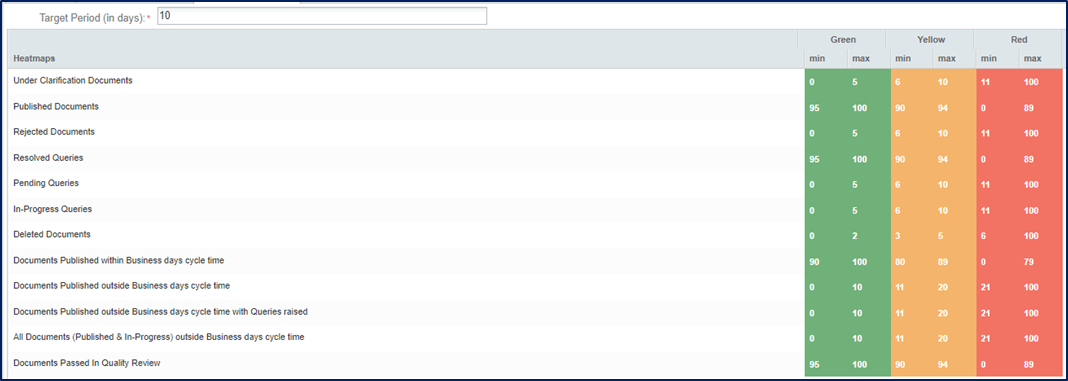
The Target Period (in days) should be set for displaying the minimum and maximum numbers of the documents.

Click the X (cross) icon to remove the numbers displayed in the colors.
 Linkedin
 X
X
