Courses Statistics
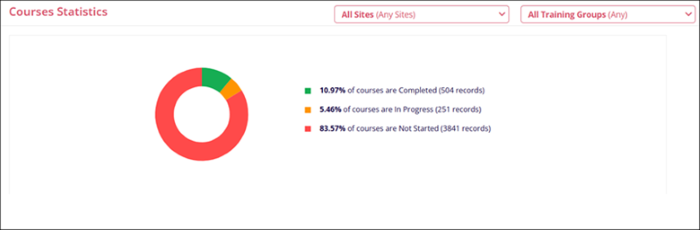
The Courses Statistics dashlet displays statistics of the courses that are Completed, In Progress, and Not Started in a donut chart.
This donut chart visually represents the data provided in the legend, showing how the courses are distributed across the different categories. The colors in the donut correspond to the legend items, with the size of each segment reflecting the percentage associated with each status.
Users can perform the following on this dashlet.
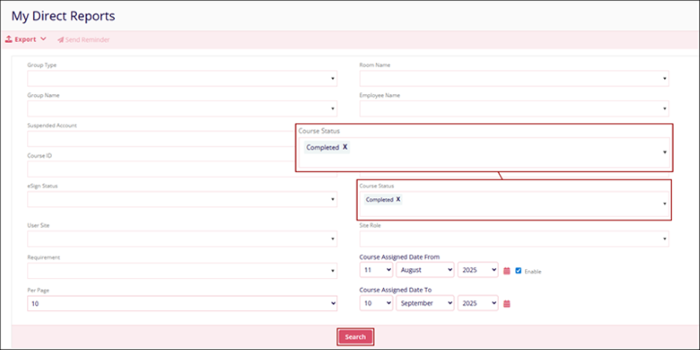
My Direct Report for specific status
- Click on a segment in the donut chart to get a transcript for courses with that
particular status.
- The My Direct Reports screen shows the pre-applied filters.
- Click on the Search button to get the results.
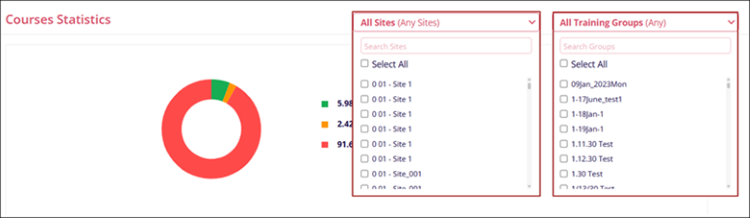
Course Statistics Filters
To apply filters, click on the All Sites and/or All Training Groups filter dropdown and select the required filter criteria by clicking on the particular options checkbox.
Note:
Users with the Learner role cannot view the KPI Analytics and the related dashlets.
TransPerfect’s Trial Interactive is an industry leader in practical, global eClinical innovation
PRODUCTS
 Linkedin
 X
X
Didn’t find what you need?
Our dedicated Project Management and Client Services team will be available to meet your needs
24 hours a day, 7 days a week.
Toll Free:
(888) 391-5111
help@trialinteractive.com
© 2025 Trial Interactive. All Rights Reserved
