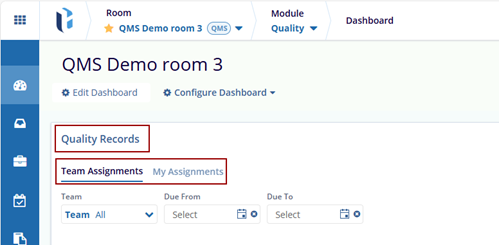
Quality Records
The Quality Records dashlet consists of two sections:
- Team Assignments
- My Assignments
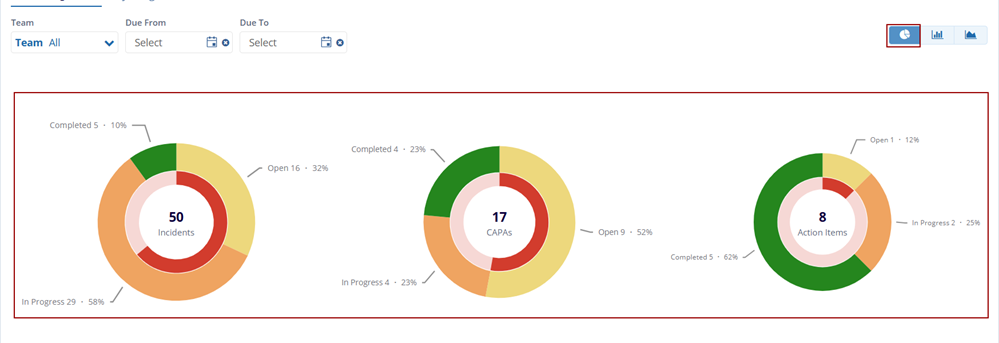
The Quality Records section also presents the records in chart format, for example:
- Donut Chart
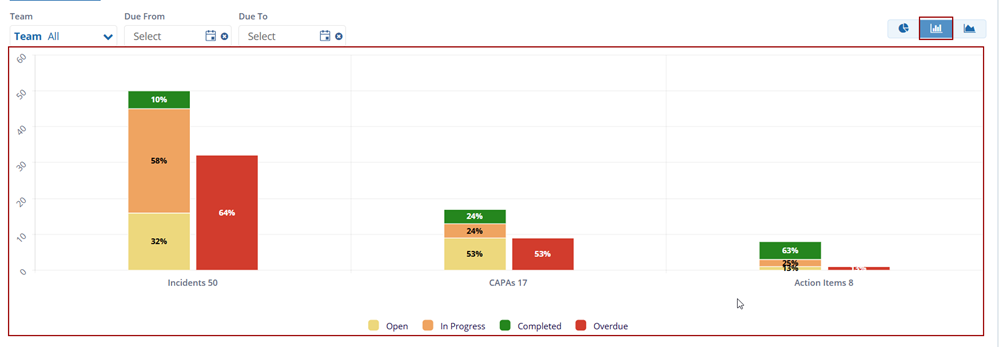
- Stacked Column Chart
- Stacked Bar Chart
Donut Chart: A Donut Chart displays data in a circular format, similar to a pie chart, with a hollow center, making it easier to compare proportions across categories.
Stacked Column Chart: A Stacked Column Chart displays data in vertical columns where values are stacked on top of each other, showing the total and the contribution of each category.
Stacked Bar Chart: A Stacked Bar Chart displays data in horizontal bars where segments are stacked to show both the total and the breakdown across categories.
TransPerfect’s Trial Interactive is an industry leader in practical, global eClinical innovation
PRODUCTS
 Linkedin
 X
X
Didn’t find what you need?
Our dedicated Project Management and Client Services team will be available to meet your needs
24 hours a day, 7 days a week.
Toll Free:
(888) 391-5111
help@trialinteractive.com
© 2025 Trial Interactive. All Rights Reserved
