My Course Statistics
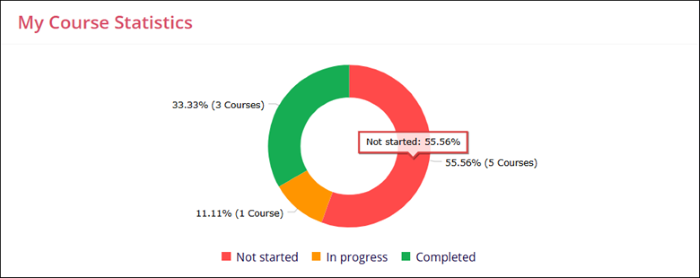
The My Course Statistics dashlet displays a donut that indicates the distribution of courses assigned to a learner, categorized as Not Started, In Progress, and Completed. Additionally, the dashlet displays the numerical values alongside percentage indicators on the course completion status donut chart.
Refer to the table below to understand the color code and its indications.
| Color Code | Status |
| Red | Not Started |
| Yellow | In Progress |
| Green | Completed |
Hovering the mouse over each partition on the donut circle displays the total count of courses in the particular status and their progress in percentage. Clicking the partition detaches it from the donut circle.
TransPerfect’s Trial Interactive is an industry leader in practical, global eClinical innovation
PRODUCTS
 Linkedin
 X
X
Didn’t find what you need?
Our dedicated Project Management and Client Services team will be available to meet your needs
24 hours a day, 7 days a week.
Toll Free:
(888) 391-5111
help@trialinteractive.com
© 2025 Trial Interactive. All Rights Reserved
