CRA Visit Report Performance Dashlet
The CRA Visit Report Performance dashlet provides insight into site visit report activity and efficiency. The visuals help users to quickly assess report progress and performance across studies. It features two visual components:
- A pie chart showing the total number of site visit reports broken down by their current status
- Tachometer graphs displaying percentage of site visit reports:
- Complete on First Submission
- Currently Rejected
- Past Due
- Approve
- A numeric display of the average number of review cycles for submitted reports
Users can use this dashlet to:
- Monitor the volume and status of visit reports
- Track average review cycle counts for process efficiency
- Filter performance metrics by study, reviewer, CRA, or sponsor
- Identify bottlenecks or delays in the review process
A user can perform the following on this dashlet.
- Click on the CRA, Study, Sponsor, and Reviewer filters to customize the dial chart.
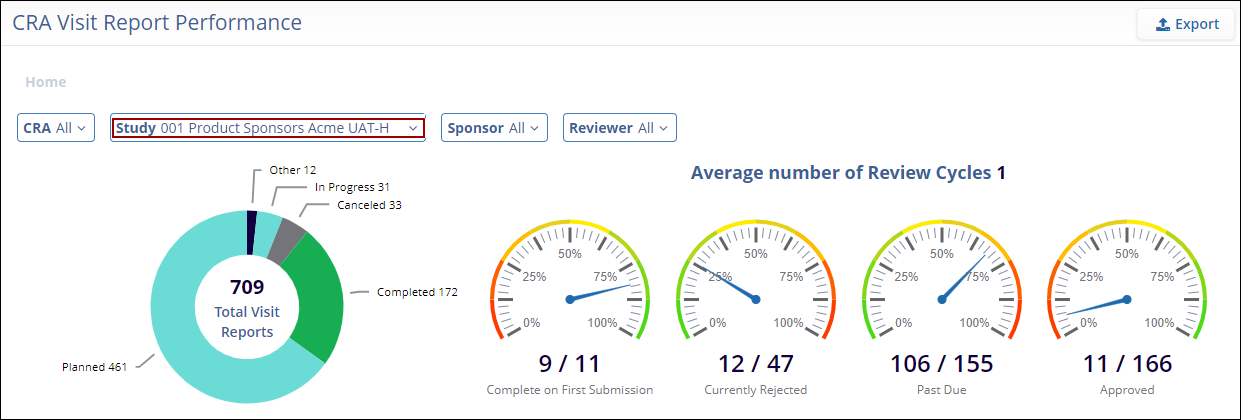
- The tachometer graphs show the site visit reports categorized by their statuses.
Hovering over the dials reveals a brief description of the chart statistics.
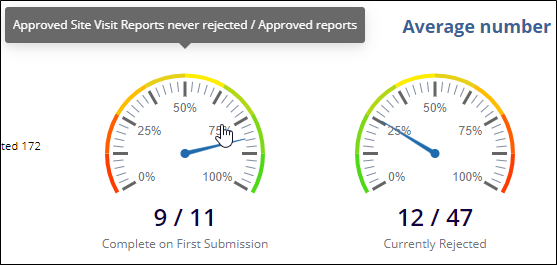
In the above image, the Complete on First Submission tachometer shows that 9 out of 11 are approved site visit reports that were never rejected.
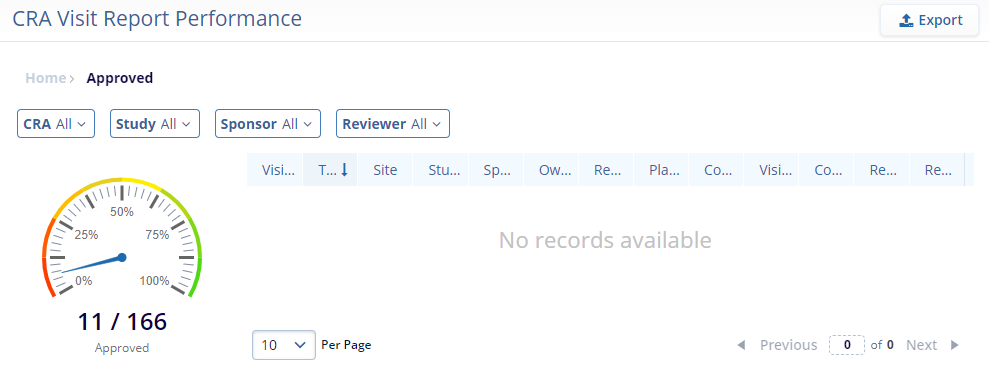
- Click on an individual chart to open the chart-related details in a tabular format
as well.
- Click on the Export button to retrieve an export of the current or custom pages.
Note: The details in the file exported differ but the process is similar
to Exporting Contacts.
TransPerfect’s Trial Interactive is an industry leader in practical, global eClinical innovation
PRODUCTS
 Linkedin
 X
X
Didn’t find what you need?
Our dedicated Project Management and Client Services team will be available to meet your needs
24 hours a day, 7 days a week.
Toll Free:
(888) 391-5111
help@trialinteractive.com
© 2025 Trial Interactive. All Rights Reserved
