Domain level Dashboards
The customizable dashboards in TI Analytics enable users to monitor site performance, check the trial metrics, use dynamic visualizations to drive informed decisions and optimize trial outcomes.
The TI Analytics module displays the following dashboards at the domain level.
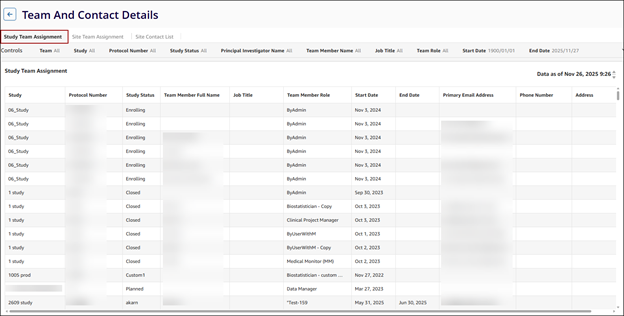
Study Team Assignment
The Cross Study Team Assignment dashboard displays a comprehensive, domain-level view of study team assignments across all studies within the customer’s domain/CTMS. The dashboard consolidates data from multiple studies and displays it in one place.
To access the Cross Study Team Assignment dashboard, follow the steps below
- Click on the Study Team Assignment dashboard tab.
- Click on the ellipsis (vertical three dots) icon, and select the Export to CSV or Export to Excel option to retrieve the dashboard data into the respective file formats.
- Expand the filters section and apply the filters to view data as per selected
criteria.
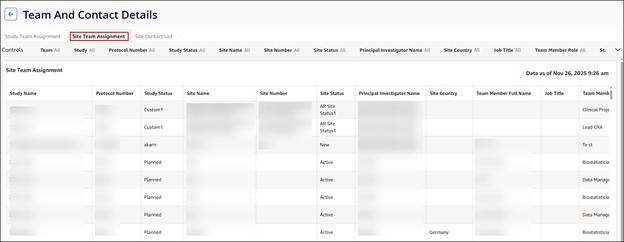
Site Team Assignment
The Site Team Assignment dashboard offers comprehensive insights into site team assignments across studies.
To access the Site Team Assignment dashboard, follow the steps below:
- Click on the Site Team Assignment Dashboard tab.
- Click on the ellipsis (vertical three dots) icon, and select the Export to CSV or Export to Excel option to retrieve the dashboard data into the respective file formats.
- Expand the filters section and apply the filters to view data as per selected
criteria.
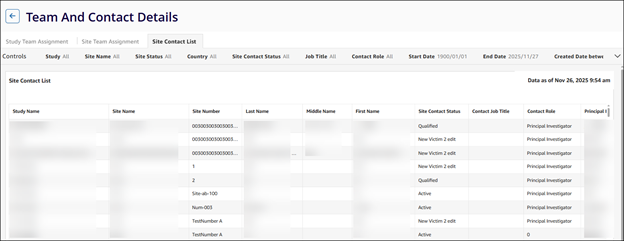
Site Contact List
The Site Contact List dashboard displays all site contacts across all studies.
To access the Site Team Assignment dashboard, follow the steps below:
- Click on the Site Contact List Dashboard tab.
- Click on the ellipsis (vertical three dots) icon, and select the Export to CSV or Export to Excel option to retrieve the dashboard data into the respective file formats.
- Expand the filters section and apply the filters to view data as per selected
criteria.
TransPerfect’s Trial Interactive is an industry leader in practical, global eClinical innovation
PRODUCTS
 Linkedin
 X
X
Didn’t find what you need?
Our dedicated Project Management and Client Services team will be available to meet your needs
24 hours a day, 7 days a week.
Toll Free:
(888) 391-5111
help@trialinteractive.com
© 2025 Trial Interactive. All Rights Reserved
