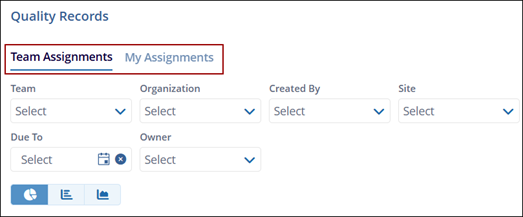
Quality Records Dashlet
The Quality Records dashlet consists of two sections:
- Team Assignments
- My Assignments
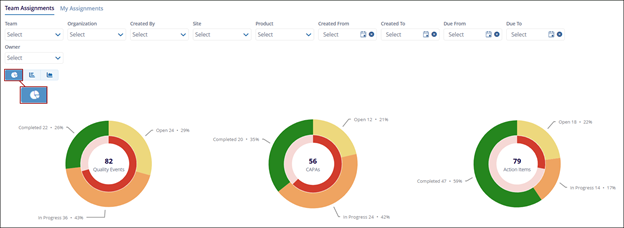
The Quality Records section also presents the records in chart format, for example:
- Donut Chart
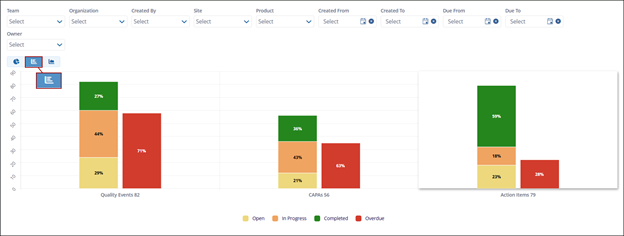
- Stacked Column Chart
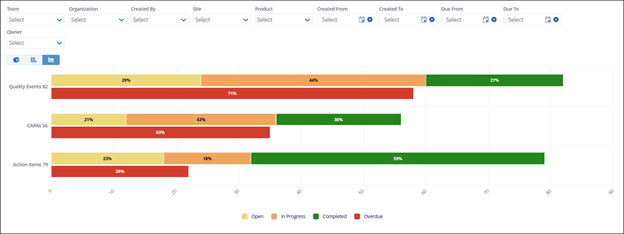
- Stacked Bar Chart
Donut Chart: This donut chart provides a visual overview of quality records and their distribution across different status categories, such as Completed, In Progress, Overdue, and Open.
Stacked Column Chart: The Stacked Column Chart displays data in vertical columns where values are stacked on top of each other, showing quality records and their distribution across different status categories, such as Completed, In Progress, Overdue, and Open
Stacked Bar Chart: A Stacked Bar Chart displays data in horizontal bars where segments are stacked to show quality records and their distribution across different status categories, such as Completed, In Progress, Overdue, and Open.
© 2025 Trial Interactive. All Rights Reserved
