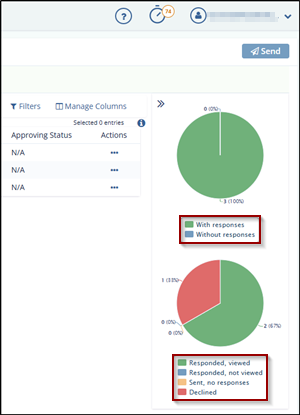
Pie Charts
Pie Charts give a complete graphical overview of the Form Responses and Statuses.
This panel displays two the following graphs:
- Form Responses Pie Graph
- Message Status Pie Graph
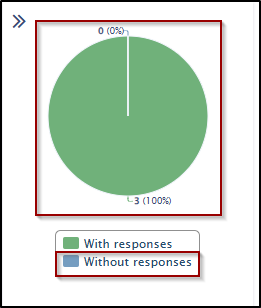
Form responses Pie Graph
This graph displays the percentage and number of forms with and without responses.
The user can hover your mouse over the graph to view the exact count and percentage of forms with and without responses.
Clicking a section of the pie chart detaches it and displays a table listing the forms corresponding to that response status.
Additionally, the user can click an item in the legend to exclude it from the graph’s calculation.
 +
+
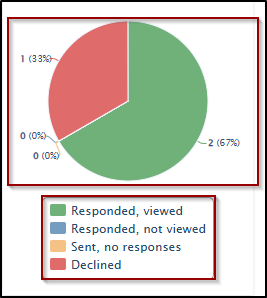
Message Status Pie Graph Hover a mouse over the graph to view the count of forms and numerical percentage with and without responses.
Clicking a pie on a graph detaches it from a graph and displays a form with the specific responses in a table. You can also click an item in a legend to exclude it from the calculation in a graph.
This graph displays the percentage and the number of forms in different status:
Responded, Viewed.
Responded, not viewed.
Sent, no responses.
Declined.
TransPerfect’s Trial Interactive is an industry leader in practical, global eClinical innovation
PRODUCTS
 Linkedin
 X
X
Didn’t find what you need?
Our dedicated Project Management and Client Services team will be available to meet your needs
24 hours a day, 7 days a week.
Toll Free:
(888) 391-5111
help@trialinteractive.com
© 2025 Trial Interactive. All Rights Reserved
