Sites Dashlet
The Sites dashboard provides a list of sites involved in clinical trials or studies, displaying details for Expiring Sites, Site Health (CRA), Recently Updated Sites, Site Activation Status, E-Feasibility by Country, and Study Monitoring Visits.
It includes the following tabs:
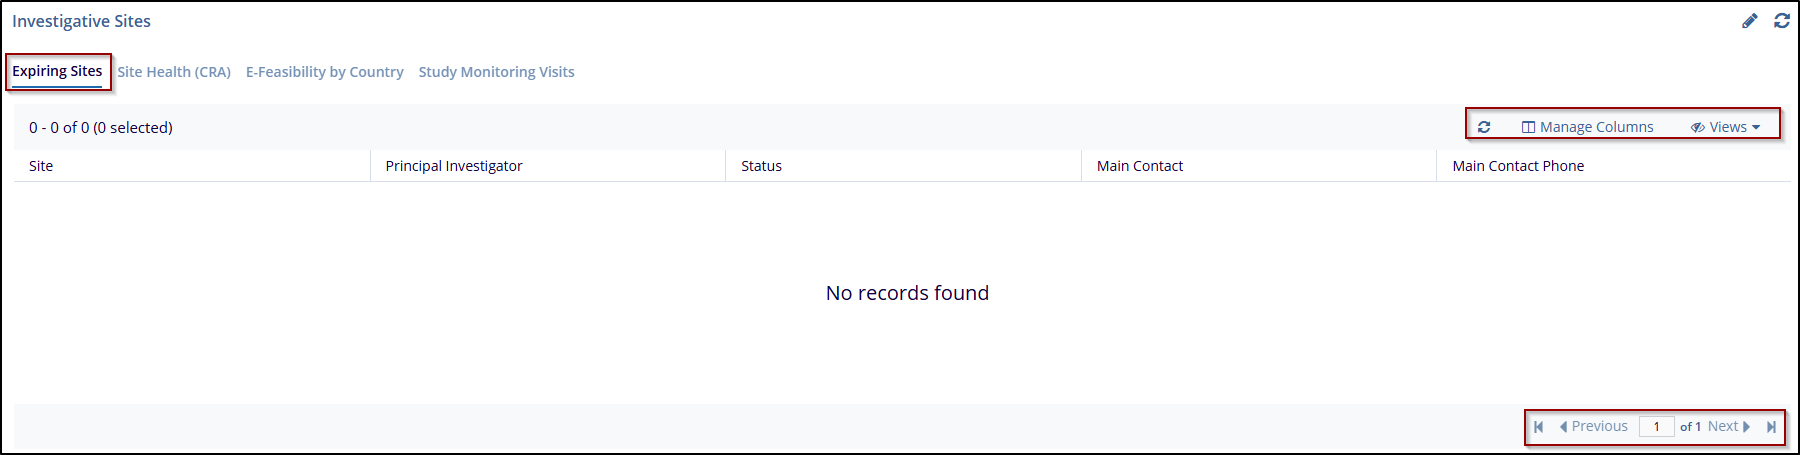
Expiring Sites
The Expiring Sites tab provides a list of all sites that have an upcoming expiration date. This tab includes columns displaying details such as Expiration Date, Site, Principal Investigator, Status, Main Contact, and Main Contact Phone. Users can further customize the view by clicking Manage Columns to add or remove specific columns as needed. This feature helps users track sites with approaching expiration dates, ensuring timely actions can be taken.
Site Health (CRA)
The Site Health (CRA) tab provides a summary of the completion status for multiple sites, allowing users to monitor site progress effectively. This tab features three chart types—Donut, Bar, and Column—that display the percentage of tasks completed out of the total for each site. Users can also Export the data for external reporting or analysis. Additionally, the All Sites dropdown menu allows for filtering, enabling users to narrow down the view to specific sites or groups as needed.
Follow the steps below to view Site Health (CRA)
- Navigate to the Investigative Site dashboard, and click on the Site Health (CRA) tab.
- The user can view the Site Health (CRA) Chart through the Donut, Bar, and Column view by selecting it.
- This will update the display of each site’s completion status in the chosen format.
- Use the All-Sites dropdown menu to filter which sites appear in the view. This is
helpful to users if they want to focus on specific site data.

- Click on the Export button to download the data currently displayed. This option allows the user to save the information for further review or to include it in reports.
Recently Updated Sites
The Recently Updated Sites tab provides a list of sites that have recent updates, allowing users to monitor site progress and activity status. This tab displays details including Site, Principal Investigator, Status, and Progress %. Users can customize the display by managing columns, refreshing the data, and viewing all sites. This tab helps users keep track of site activity and status updates, which can be essential for ensuring that all sites meet project requirements.
- Click View All Sites in the top right corner if the user wants to see the complete list of sites without any filters applied.
- Use the Refresh button to update the information displayed in the list. This ensures the user is viewing the most
- Click Manage Columns to customize the information displayed. The user can add
or remove columns need to focus on specific details relevant to the review.

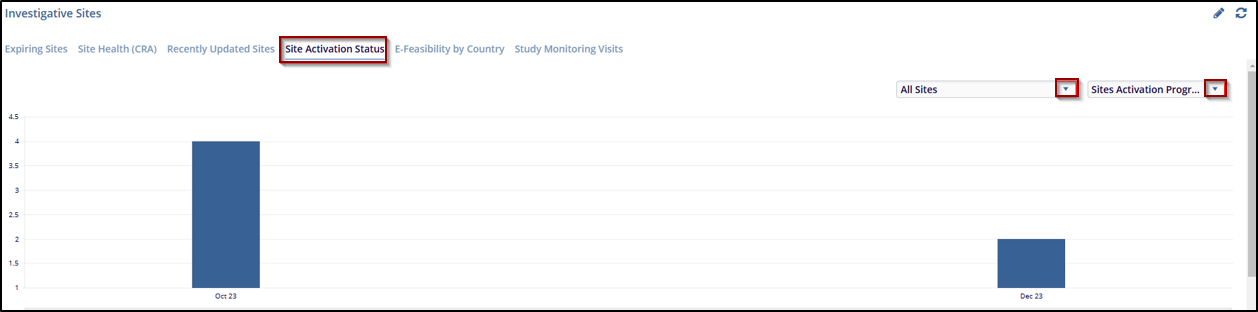
Site Activation Status
The Site Activation Status tab displays a bar chart showing the activation progress of sites over time. This tab allows users to filter by site groups and activation progress type, making it easier to track which sites are moving through the activation stages. The chart provides a representation of site activation on specific dates, helping users quickly assess activation trends and identify any sites that may require further action.
- Use the All-Sites dropdown menu to filter the chart by specific site groups, allowing the users to focus on a subset of sites relevant to the review.
- In the second dropdown menu, choose the desired Site Activation Progress type to adjust the chart based on specific activation criteria or milestones.
- Review the bar chart to see the number of sites activated on specific dates. Each
bar represents the count of sites that reached the activation milestone on that date.
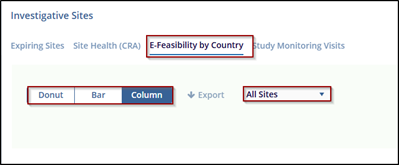
E-Feasibility by Country
The E-Feasibility by Country tab provides an overview of the feasibility assessments sent to sites in different countries. The data is presented in a chart format that can be viewed as a Donut, Bar, or Column chart, giving flexibility in how the information is displayed. This tab also includes an Export option to download the data for external analysis or reporting. The All Sites dropdown allows users to filter the sites by specific groups, focusing the view on particular sets of sites or regions. This feature helps users quickly see the distribution and count of feasibility assessments across countries.
Follow the steps below to view or export efeasibility data:
- Select the preferred chart format by clicking Donut, Bar, or Column. This will change how the feasibility data is displayed, allowing the user to choose the visualization that best suits the analysis.
- Use the All-Sites dropdown to filter the data by specific site groups or regions, making it easy to focus on certain countries or subsets of sites.
- Click on the Export button to download the efeasibility data currently displayed in the chart. This option is useful for creating reports or conducting further analysis outside of the system.
-
The chart shows the total number of sites with efeasibility assessments for each country. For example, the Donut chart format indicates 1 Total site in India with a feasibility status of Sent.
Study Monitoring Visits
The Study Monitoring Visits tab provides a breakdown of the monitoring visits conducted over specific periods. Users can view visit data by month and year, with each circular chart displaying the total number of visits for that time and color-coded segments representing various document types (e.g., PI Curriculum Vitae, Protocol Amendment, Administrative Changes). The tab offers flexibility to change the chart type between Donut, Bar, and Column views, and an Export button to download the data. The date range can be adjusted using the date fields to focus on specific periods, helping users track and analyze visit trends over time.
Follow the steps below to manage study monitoring Visits:
- Navigate to the Investigative Site dashboard, and click on the Study Monitoring Visits tab.
- Choose the date range for the data by selecting the start date (on the left) and end date (on the right). This will update the charts to show visits within the specified time frame.
- Select Donut, Bar, or Column to choose the preferred chart format. This will change the display of the visit data, allowing the user to view the information in a format that best suits their needs.
- Use the By Month dropdown to organize the data by monthly intervals. This option can help in viewing trends over each month within the selected date range.
- Click on the Export button to download the current view's data. This is useful for external analysis or reporting needs.
- Each circular chart shows the Total visits for a specific month or period, with
color-coded segments indicating different document types or actions completed during
those visits. For example, May 2023 shows - 2 Total Visits, with each color
representing different documents related to the visit.

 Linkedin
 X
X
