Reports (Heatmap Settings)
Trial Interactive allows the display of cross-room metrics in the KPI Dashboard, which can be accessed from the Home screen.
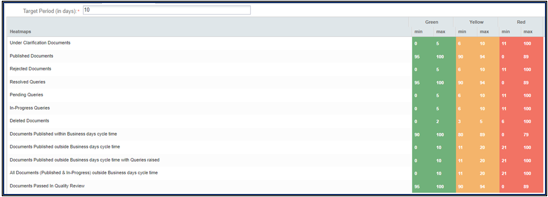
The KPI Dashboard-Heatmap in the Trial Interactive settings provides a quick visual overview of key performance indicators (in numbers) across various categories, such as:
- Under Clarification Documents
- Published Documents
- Rejected Documents
- Resolved Queries
- Pending Queries
- In-Progress Queries
- Deleted Documents
- Documents Published within Business days cycle time
- Documents Published outside Business days cycle time
- Documents Published outside Business days cycle time with Queries raised
- All Documents (Published & In-Progress) outside Business days cycle time
- Documents Passed In Quality Review
The heatmap uses color-coded thresholds (Green, Yellow, Red) to indicate performance levels or urgency.
To configure KPI Dashboards Heatmap, follow the steps below:
- Within the Settings module, expand the Reports dropdown and select KPI Dashboard-Heatmaps option.
- Set the Target Period (in days) for displaying the minimum and maximum numbers of the documents.
- Double-click on the heatmap cells and specify the minimum and maximum data range for each category.
- Click on the x icon to remove a specific category.
- Click Save.
 Linkedin
 X
X
